
The Mortgage Analytics and Performance Dashboard (MAPD) received its final update with data through December 2021. MAPD is preserved on the Atlanta Fed’s website for historical purposes.
“If you are experiencing financial distress due to the COVID-19 and cannot make a mortgage payment, please press 1.” Home loan borrowers across the United States met similar messages during the pandemic when contacting their lenders. The option for forbearance—pausing or reducing mortgage payments—provided many the ability to stay in their homes.
It’s clear that homeowners across the country have had trouble paying their mortgages. The rates of homes in delinquency—at least 30 days overdue on one mortgage payment—rose. Those taking advantage of forbearance did as well. Thankfully, that reduced delinquency. How many homes are affected in your community? A new Atlanta Fed tool lets you find out.
The Mortgage Analytics and Performance Dashboard (MAPD) lets you explore mortgage forbearance and delinquency data at national, state, county, and zip code levels. Because other sources often focus on large-scale financial impacts, geographic detail like this is hard to come by. Having it, though, makes it easier for nonprofits and policymakers to draw clearer lines to pockets of distress, existing and emerging. In the right hands, that can lead to better targeted support.
We talked with Daniel Sexton and Jessica Dill from the Atlanta Fed’s Center for Housing and Policy about MAPD. They shared examples of how it helps homeowners, the trends it uncovers, and how you can use it in your work.
Community development professionals and policymakers need data to ensure pandemic-relief assistance reaches the most vulnerable homeowners. Where does MAPD fit in?
Daniel Sexton: MAPD lets you track the average rates of mortgage delinquency and mortgage forbearance in your community at the state, county, or zip-code level. We chose these indicators for two reasons. First, the pandemic could cause a lot of people to not be able to make payments. This is the delinquency piece. Second, there was a lot happening with mortgage-relief programs. The biggest of these relief efforts came in the form of mortgage forbearance.
Jessica Dill: Looking at these indicators simultaneously gave us a good sense of both where there is distress and how many distressed households are [getting] assistance. We thought that these two metrics best captured that.
Community leaders across the country have taken extraordinary measures to help keep people in their homes during the pandemic. They have introduced new policies, created new programs, and partnered with other officials, agencies, and nonprofits. And they have done so swiftly. How has MAPD been used to help?
Daniel Sexton: One example is the $10 billion Homeowner Assistance Fund (HAF) created through the American Rescue Plan Act. It requires states and tribes to create a data-driven assessment of homeownership needs in order to receive all of the funds available to them. This assessment creates a plan to ensure that funds reach struggling homeowners.
We wanted to put data at the fingertips of policymakers so they could make informed decisions about how to distribute funds. Ultimately, this provides direct relief for homeowners.
-Daniel Sexton, Atlanta Fed | Center for Housing and Policy
Already, governments have used MAPD to identify communities with a significant number of homeowners facing challenges with their mortgages. The tool also identifies characteristics of those communities. We wanted to put data at the fingertips of policymakers so they could make informed decisions about how to distribute funds. Ultimately, this provides direct relief for homeowners.
What are some trends you’ve detected? How do they affect the future for struggling homeowners?
Jessica Dill: Forbearance and delinquency tend to move in opposite directions. As forbearance uptake increased, the share of delinquent loans declined. As people exit forbearance, we may find that distressed homeowners are not able to stay current on their mortgages. They may not be able to work out alternative arrangements with their lenders. This could result in an increase in delinquency. It is something we are keeping an eye on.
Daniel Sexton: However, it is interesting to note that as borrowers’ forbearance plans have ended, many have become current [in repayment of their mortgage loans]. These patterns over the past few months could foreshadow what borrowers experience moving forward.
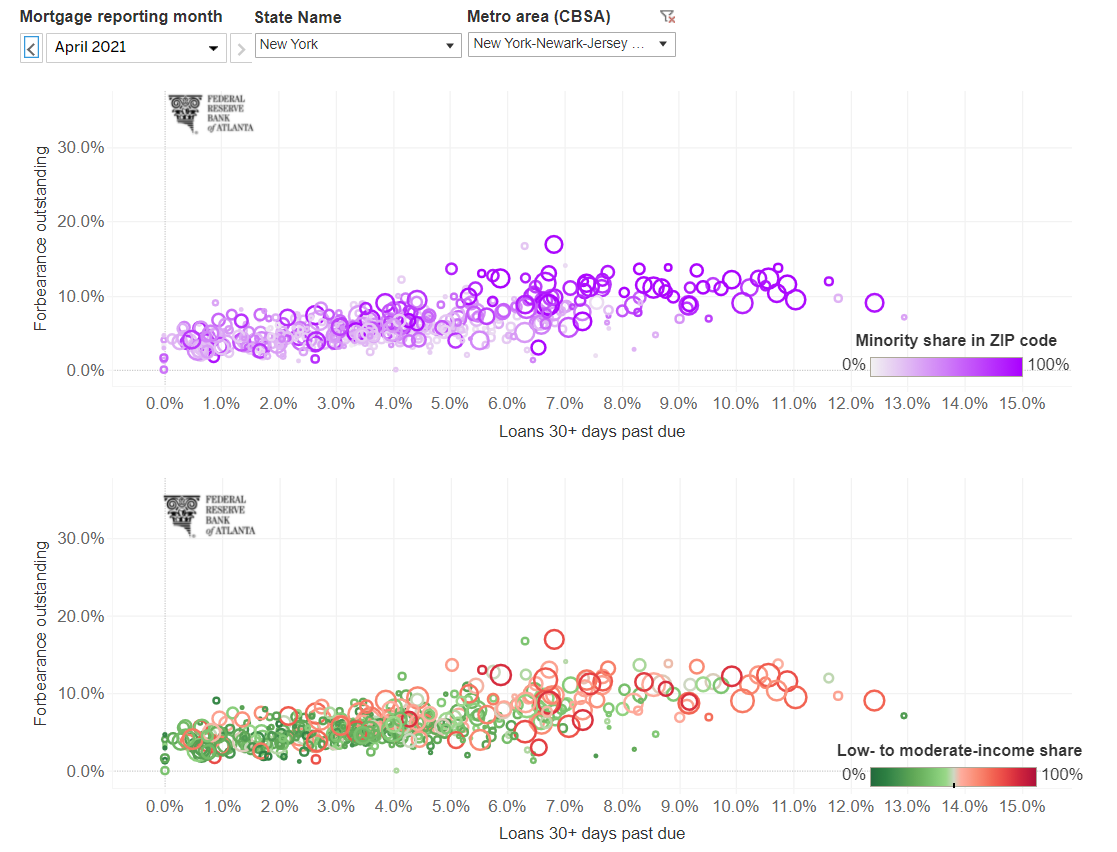
Mortgage Analytics and Performance Dashboard
In this example, the MAPD displays Mortgage Nonpayments by Race and Income for New York state in the New York-New Jersey-Newark, NY-NJ-PA metro area in April 2021.
You mention the geographic precision of MAPD. Why does that matter?
Jessica Dill: Two things make this tool unique. One is the ability to know which delinquent homeowners are receiving assistance. The other is ability to measure [delinquency and assistance] metrics at such a small geographic level. Distress hits at the local level. If you only know the national, state, or county figures, it may not be that helpful.
Daniel Sexton: For instance, in a large county it is important to have a really fine view for the distribution of a lot of money. There could be distress occurring in different pockets of the county.
Uptake of mortgage forbearance has been uneven since the beginning of the pandemic. Why was it important to add information about race and income to MAPD?
Jessica Dill: The beauty of the tool is that it looks at where distress is happening and examines who lives in those communities. We can’t say what the characteristics are of the borrower. But we can see the characteristics of the community. The question we were trying to answer: “Is forbearance uptake and mortgage delinquency distributed equally across communities, or is it concentrated?”
Also, we wanted to identify the demographic characteristics of the communities where forbearance and delinquency rates are the highest.
We observe in the data that rates are highest in communities with high shares of non-white households and high shares of lower-income households. We think that is important to highlight and lift up these differences for policymakers looking to target assistance to those most in need.
How do people learn about the tool?
Daniel Sexton: This happened in several ways. Many state agencies responsible for developing assessment plans came to us. We also shared the tool with states through a national trade association.
Jessica Dill: We wanted to make sure that [local and regional] agencies in our backyard knew about this resource.
Ready to take a look for yourself? Explore what’s happening with mortgage delinquency and forbearance activity in your community with MAPD. Share this article or the tool with your professional network if you work in housing and policy.
MAPD uses the Equifax Credit Risks Insight Servicing dataset and Black Knight McDash data to estimate forbearance and delinquency rates with a lag of three to four months. The tool is updated monthly.